Paso 4: Iniciar la aplicación
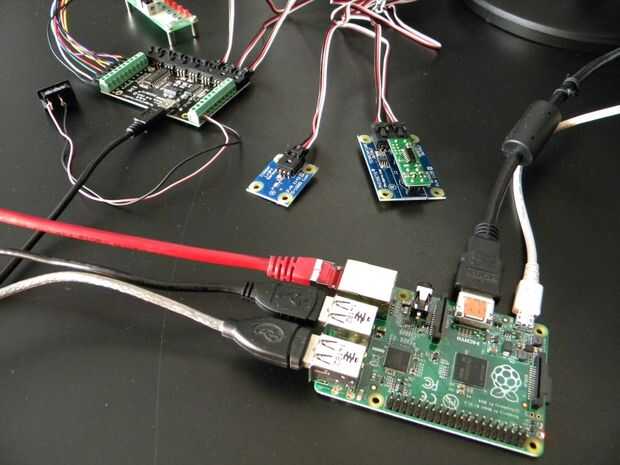
Reemplace el contenido del archivo ifkit.py con este
crontab -e
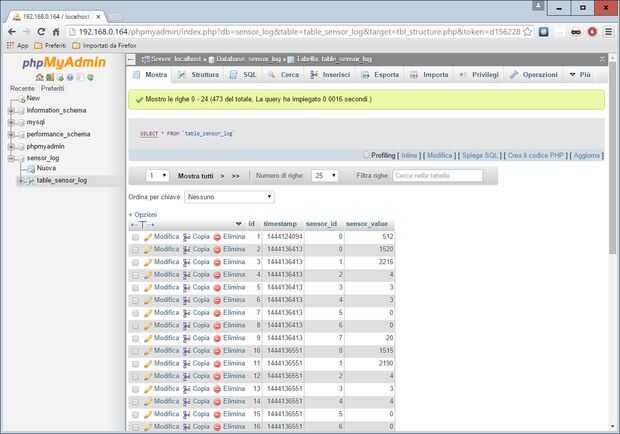
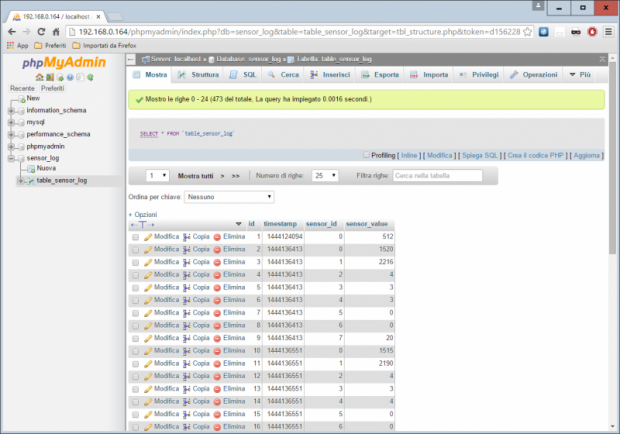
Cuando ejecutamos el script se leerá el valor de los sensores y a través de la función insert_to_db los valores se guardan en la base de datos.
MAILTO="" */3 * * * * sudo python /home/pi/sensor_logger/ifkit.py
Podemos automatizar la secuencia de comandos a través de crontab, por ejemplo a sudo mkdir /home/pi/sensor_logger/web iniciar cada 3 minutos
sudo nano /home/pi/sensor_logger/web/index.html
y añadir estas líneas al final del archivo
MAILTO = "" * / 3 **** <html> <head> <title>Emmeshop tutorial</title> <script src="http://ajax.googleapis.com/ajax/libs/jquery/1.9.1/jquery.min.js" type="text/javascript"></script> <script src="http://code.highcharts.com/highcharts.js"></script> <script src="http://code.highcharts.com/modules/exporting.js"></script> <script type="text/javascript" src="data.js" ></script> </head> <body> <div id="chart" style="height: 400px; margin: 0 auto"></div> </body> </html>
Highcharts
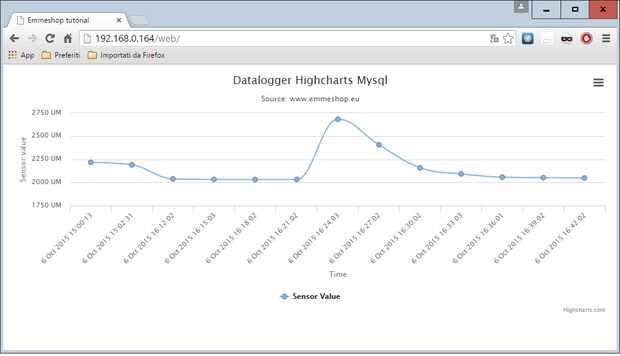
Ahora que los datos se almacenan en la base de datos hay muchas maneras de ver, aquí utilizamos Highcharts para mostrarlos gráficamente
Crear una nueva carpeta con permisos de derecho
sudo nano /home/pi/sensor_logger/web/values.php
crear un archivo index.html
<?php $con = mysql_connect("localhost","root","raspberry"); if (!$con) { die('Could not connect: ' . mysql_error()); } mysql_select_db("sensor_log", $con); $result = mysql_query("SELECT * FROM `table_sensor_log` WHERE sensor_id=1 ") or die ("Connection error"); while($row = mysql_fetch_array($result)) { echo $row['timestamp'] . "/" . $row['sensor_value']. "/" ; } mysql_close($con); ?> con este contenido
sudo nano /home/pi/sensor_logger/web/data.js
un archivo values.php
$(function() { var x_values = []; var y_values = []; var switch1 = true; $.get('values.php', function(data) { data = data.split('/'); for (var i in data) { if (switch1 == true) { var ts = timeConverter(data[i]); x_values.push(ts); switch1 = false; } else { y_values.push(parseFloat(data[i])); switch1 = true; } } x_values.pop(); $('#chart').highcharts({ chart : { type : 'spline' }, title : { text : 'Datalogger Highcharts Mysql' }, subtitle : { text : 'Source: www.emmeshop.eu' }, xAxis : { title : { text : 'Time' }, categories : x_values }, yAxis : { title : { text : 'Sensor value' }, labels : { formatter : function() { return this.value + ' UM' } } }, tooltip : { crosshairs : true, shared : true, valueSuffix : '' }, plotOptions : { spline : { marker : { radius : 4, lineColor : '#666666', lineWidth : 1 } } }, series : [{ name : 'Sensor Value', data : y_values }] }); }); }); function timeConverter(UNIX_timestamp){ var a = new Date(UNIX_timestamp * 1000); var months = ['Jan','Feb','Mar','Apr','May','Jun','Jul','Aug','Sep','Oct','Nov','Dec']; var year = a.getFullYear(); var month = months[a.getMonth()]; var date = a.getDate(); var hour = a.getHours(); var min = a.getMinutes() < 10 ? '0' + a.getMinutes() : a.getMinutes(); var sec = a.getSeconds() < 10 ? '0' + a.getSeconds() : a.getSeconds(); var time = date + ' ' + month + ' ' + year + ' ' + hour + ':' + min + ':' + sec ; return time; } con este contenido
sudo ln -s /home/pi/sensor_logger/web /var/www/web
y un archivo data.js
con este contenido
crear un vínculo a la carpeta del servidor Web
OK, ahora estamos listos para leer valores de sensores.
En el archivo index.html hay los enlaces para jquery y Highcharts.
El archivo value.php se conecta a la base de datos y Lee los valores (en este ejemplo, sólo los sensores con id 1).
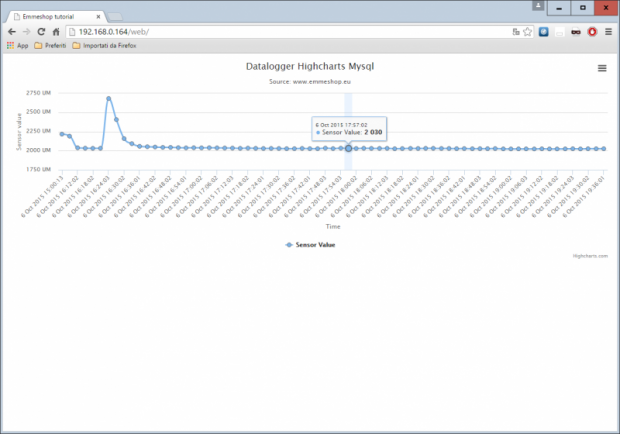
El data.js formatos de archivo y mostrarlos gráficamente
Abra su navegador en http://raspberry-ip/web puedes ver tu carta astral
