Paso 2: Preparaciones de tarjeta SD
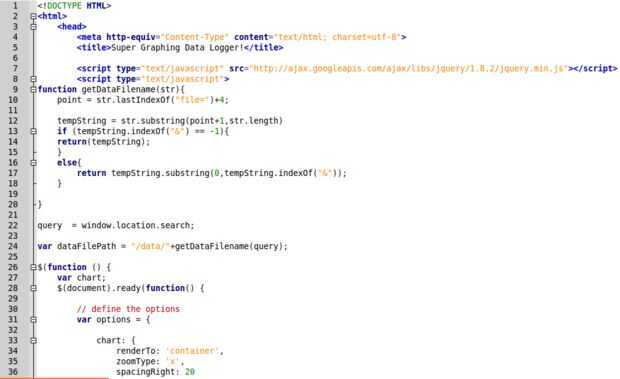
Antes de empezar, tenemos nuestra tarjeta SD esté bueno para ir. Debe ser formateado como un sistema de archivos FAT16 o FAT32, los detalles están disponibles en la página oficial de Arduino. Una vez hecho esto, tenemos que garantizar dos cosas están presentes en el directorio raíz de la tarjeta: el archivo HC.htm y datos de unas directorio de los archivos de datos. El directorio de datos se realiza fácilmente con el mismo equipo que fue utilizado para formatear la tarjeta siempre y cuando uno tiene un lector de tarjetas SD de algún tipo. El HC.htm consiste simplemente en el código siguiente:
<!DOCTYPE HTML> <html> <head> <meta http-equiv="Content-Type" content="text/html; charset=utf-8"> <title>Super Graphing Data Logger!</title> <script type="text/javascript" src="http://ajax.googleapis.com/ajax/libs/jquery/1.8.2/jquery.min.js"></script> <script type="text/javascript"> function getDataFilename(str){ point = str.lastIndexOf("file=")+4; tempString = str.substring(point+1,str.length) if (tempString.indexOf("&") == -1){ return(tempString); } else{ return tempString.substring(0,tempString.indexOf("&")); } } query = window.location.search; var dataFilePath = "/data/"+getDataFilename(query); $(function () { var chart; $(document).ready(function() { // define the options var options = { chart: { renderTo: 'container', zoomType: 'x', spacingRight: 20 }, title: { text: 'Light levels recorded by the Arduino' }, subtitle: { text: 'Click and drag in the plot area to zoom in' }, xAxis: { type: 'datetime', maxZoom: 2 * 3600000 }, yAxis: { title: { text: 'Light Levels (0 - 1024)' }, min: 0, startOnTick: false, showFirstLabel: false }, legend: { enabled: false }, tooltip: { formatter: function() { return '<b>'+ this.series.name +'</b><br/>'+ Highcharts.dateFormat('%H:%M - %b %e, %Y', this.x) +': '+ this.y; } }, plotOptions: { series: { cursor: 'pointer', lineWidth: 1.0, point: { events: { click: function() { hs.htmlExpand(null, { pageOrigin: { x: this.pageX, y: this.pageY }, headingText: this.series.name, maincontentText: Highcharts.dateFormat('%H:%M - %b %e, %Y', this.x) +':<br/> '+ this.y, width: 200 }); } } }, } }, series: [{ name: 'Light Levels', marker: { radius: 2 } }] }; // Load data asynchronously using jQuery. On success, add the data // to the options and initiate the chart. // http://api.jquery.com/jQuery.get/ jQuery.get(dataFilePath, null, function(csv, state, xhr) { var lines = [], date, // set up the two data series lightLevels = []; // inconsistency if (typeof csv !== 'string') { csv = xhr.responseText; } // split the data return into lines and parse them csv = csv.split(/\n/g); jQuery.each(csv, function(i, line) { // all data lines start with a double quote line = line.split(','); date = parseInt(line[0], 10)*1000; lightLevels.push([ date, parseInt(line[1], 10) ]); }); options.series[0].data = lightLevels; chart = new Highcharts.Chart(options); }); }); }); </script> </head> <body> <p style="text-align:center;">Please allow the chart to load, it may take up to 30 seconds </p> <hr/> <script src="http://cdnjs.cloudflare.com/ajax/libs/highcharts/2.3.5/highcharts.js"></script> <!-- Additional files for the Highslide popup effect --> <script type="text/javascript" src="http://www.highcharts.com/highslide/highslide-full.min.js"></script> <script type="text/javascript" src="http://www.highcharts.com/highslide/highslide.config.js" charset="utf-8"></script> <link rel="stylesheet" type="text/css" href="http://www.highcharts.com/highslide/highslide.css" /> <div id="container" style="min-width: 400px; height: 400px; margin: 0 auto"></div> </body> </html> Necesitará editar este archivo primero para asegurarse de que apunta hacia la ubicación preferida de los archivos de highcharts.js. Esto puede dejar como el CDN pública: http://cdnjs.cloudflare.com/ajax/libs/highcharts/2.3.5/highcharts.js, cambio para apuntar hacia su propio webhost, o incluso puede ser en la tarjeta SD de Arduino (esto será lento). No es necesario crear un archivo de datos antes de la mano, el bosquejo de la SGDL se encargará de cuando se decide a grabar su primer punto de datos. Antes de llegar lejos sin embargo, es necesario asegurarse de que hemos configurado la memoria EEPROM para el bosquejo de la SGDL.
![[Tutorial para 4DIY.ORG] - Cómo controlar LED con iphone usando [4DIY.ORG] App y Ethernet Shield [Tutorial para 4DIY.ORG] - Cómo controlar LED con iphone usando [4DIY.ORG] App y Ethernet Shield](https://foto.askix.com/thumb/170x110/8/65/8655f571aa8757ee2797df655b454b17.jpg)

