Paso 3: Trazar sus propios datos


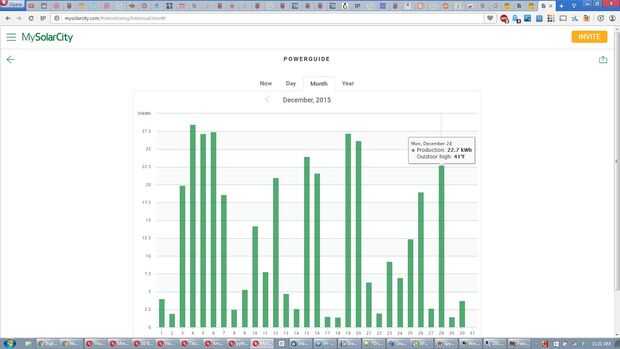
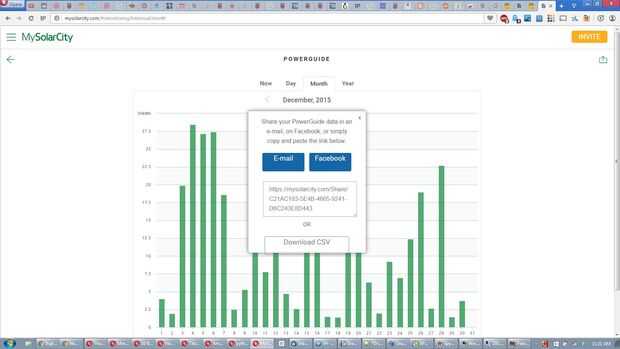
A eliminar o mover mis archivos muestra luego descargar tu propio de https://mysolarcity.com/#/monitoring/historical/da... Cuando nombre los archivos necesita nombrarlos por lo que ordena en el orden correcto de viejo a nuevo. Parecen a mi nombres de archivo: 2015_09_summary.csv. Entonces sólo vuelva a ejecutar el programa. Utilice parameter.py para controlar que los gráficos se obtiene y cuántas líneas y alisar se usa.
Creo que finalmente he descubierto la manera de código en una caja, aquí está parameters.py:
# -*- coding: utf-8 -*- # parameters for solar_city_plot.py class Parameters( object ): """ parameters manages parameter values, should be globally available, need to look into getter setter value idea may allow some to come from a file similar to an ini file casts parameter values to other types if necessary, like to string for display. note: some parameters may be marked as *todo beware that may be implemented or not, not yet checked. """ def __init__(self, aController ): self.myController = aController # save a link to the controller # begin options... # title of the plot self.plot_title = "Solar Energy Production By Day" # max value of y the energy per day self.plot_max_y = 50 # True to do bar graph, else False self.bargraph = True # True to do bar graph, else False # for multiple lines on one graph with different smoothings specify the # array below # ex: # self.smooth_vals = [ 1, 16 ] # two lines, no smoothing and 16 days for the running average # some other examples, the last on is the one that "works" self.smooth_vals = [] # for no line graph = [], len - 0 self.smooth_vals = [ 1, 2, 4, 8, 16 ] self.smooth_vals = [ 1, 4, 16 ] self.smooth_vals = [ 1, 16, 32 ] # =================== eof ==============================


